prepared for the Workshop
|
Arbuscular mycorrhizal fungi in plant production systems:
detection, taxonomy, conservation and ecophysiology
|
held in Wuhan P.R. China at the
Laboratory of Agricultural Microbiology,
Huazhong Agricultural University, Wuhan, P.R. China
April 2001
ORGANISED BY
Dr. John C. Dodd, Dr. Justin P. Clapp - The International Institute of Biotechnology, Sittingbourne Research Centre, Kent, UK
AND
Prof. Bin Zhao - Laboratory of Agricultural Microbiology, Huazhong Agricultural University, Wuhan, PRC
WITH THE COLLABORATION OF :
Dr. Mary Jo Farmer, Laboratoire de Phytoparasitologie, INRA-CMSE, Dijon, F
Dr. Eckhard George, Institute of Plant Nutrition, Hohenheim University & IGZ, Grossbeeren, G.
Dr. Silvio Gianinazzi, Laboratoire de Phytoparasitologie, INRA-CMSE, Dijon, F
Dr. Vivienne Gianinazzi-Pearson, Laboratoire de Phytoparasitologie, INRA-CMSE, Dijon, F
Prof. Xiaolin Li, China Agricultural University, Beijing, PRC
Ms. Elke Neumann, Institute of Plant Nutrition, Hohenheim University, G
Dr. Diederik van Tuinen, Laboratoire de Phytoparasitologie, INRA-CMSE, Dijon, F
Dr. Wing Kuen Chan, Hong Kong Polytechnic University, Kowloon, Hong Kong
|
UsefulWeb Links
BEG (Banque Européenne des Glomales) website
Laboratoire de Phytoparasitologie INRA/CNRS
Mark Brundrett's Working with Mycorrhizas in Forestry and Agriculture
INVAM
Mycorrhiza Information Exchange
David Sylvia
National Centre for Biotechnology Information
Mychintec WEB page
International Science Fondation
UNESCO fellowships
COST Action 8.38 Managing arbuscular mycorrhizal fungi for improving soil quality
and plant health in agriculture
1.0 Manipulation and Staining of Spores and Roots
1.1. Spore and Root Extraction from Pot Cultures/Field Samples
Remove soil sample from the rhizosphere of the host plant growing in the pot with a 10-20mm diameter core borer. If the sample is taken from the field larger quantities should be sieved (100g-200g) and mixed into a 1L beaker of water before pouring through the sieves. Clay based soils will block the finer sieve quickly and care must be taken to tap the base of that sieve to encourage excess water to drain through. The same procedure used for pot culture material should then be followed:
- Wash the soil through 710µm and 45µm pore sieves with running water.
- Remove root material trapped on the 710µm sieve to check for attached mycelium of AMF with spores or for staining of roots (Trypan blue, Chlorazole Black E, Alkaline Phosphatase, Acid Fuchsin etc.) if required.
- Backwash the contents of the 45µm sieve into a small beaker. Try to keep the volume to a minimum.
- Swirl the beaker contents and quickly decant the contents into 50ml centrifuge tubes up to a maximum half way up the tube.
- Gently inject an equal amount of a 60% (w/v) commercial sugar (sucrose) solution into the pellet at the bottom of each tube using a syringe with a plastic tube extension. There should be a clear interface visible between the water (above) and sugar phase (below).
- Centrifuge the capped tubes at approx. 3000 rpm for 2 minutes in a bench centrifuge.
- Remove the spores caught at the interface of the two layers with the syringe and tube attachment. Start above the interface and work down into the sugar phase using a circular motion as some species produce spores which can sink in the sugar solution while others can float just above the interface.
- Pour the contents of the syringe into a clean 45µm sieve, and wash thoroughly to remove traces of sugar solution.
- Backwash contents into a Petri dish and view under a stereomicroscope
1.2. Making a permanent slide mount for reference or BEG registration
a. After extracting spores from a fresh pot culture. Isolate a minimum of 10-20 spores.
b. On two clean microscope slides place one drop each of the mountant PVLG (Polyvinyllactoglycerol) and Melzer's PVLG see annex 2.
Transfer half the spores to the first drop of mountant and the second half to the second drop using fine tip forceps (e.g. VOMM forceps No. 999220: HWC 118-10 Hammacher Instruments, P. O. Box 120209, D-42677 Solingen, Germany)
c. Try and orientate the spores so that distinguishing features will be apparent once the coverslip is added.
d. Carefully place a clean coverslip over each drop, making sure to lower the coverslip at an angle to prevent air bubbles being trapped.
e. Gently apply a pressure to the coverslips of one of the slides to break open the spores. Wait 30 seconds and then apply gentle pressure in a circular motion with a soft (B) pencil to break spore walls open further (The pressure will depend on the species of AMF). This should be done under a stereomicroscope.
f. If using PVLG, remember to allow the mountant to polymerise and top-up it up as necessary before sealing with clear nail varnish or white/silver car paint.
g. Label the slide at one end with the species name and reference code, date, your name, and the mountant used.
1.3. Histochemical Staining of Total AMF Mycelium in Roots
The presence of arbuscular mycorrhizal fungi in roots is not visible without appropriate staining. Different non-vital strains are available (eg trypan blue, chlorazole black, fuschin) to detect intraradical mycelium and they enable an estimation of the abundance of arbuscular mycorrhizal fungi within a root system (Trouvelot et al, 1986). However, they stain both dead and living fungal structures.
A fuller understanding of AM functioning requires consideration of the metabolic states of both internal and external hyphae, and the relationship between these, because the physiological interactions will necessitate the presence of an active symbiotic fungus. Activity of succinate dehydrogenase (SDH), a mitochondrial enzyme, is considered as an indicator of viability of mycorrhiza but does not appear to reflect mycorrhizal efficiency for plant growth enhancement (Vierheilig & Ocampo, 1989). Alkaline phosphatase (ALP) activity, located within the phosphate-accumulating vacuoles of AM hyphae (Gianinazzi et al., 1979) has been proposed as a physiological marker for analysing the efficiency of mycorrhiza (Tisserant et al., 1993). Measurements of these two enzyme activities make it easy to directly compare the total production of fungal tissue with the proportion that is living or functional, and to compare simultaneously the production of mycelium within roots and in soil in order to determine whether (i) biomass produced in the two compartiments is interdependent and, (ii) the proportion of metabolically active hyphae differs with time.
1.3.1 Root Preparation
a. Wash the roots free of soil.
b. Cut roots into 1cm long segments.
1.3.2 Trypan blue staining of total mycelium
- Clear roots in 2% (w/v) KOH (10% can be used for very pigmented tree roots) for 15 min at 120°C in a pressure cooker (1h at 90°C in a water bath or oven) (Do not use samples that are more than 2g.
- Rinse roots with water three times on a fine sieve or using a mesh and forceps.
- Cover roots with 2% (v/v) HCl for at least 30 mins and preferably longer.
- Throw away the HCl and cover roots with 0.05% (w/v) trypan blue in lactoglycerol (1:1:1 lactic acid, glycerol and water 5:1:1 may be used if tree roots are to be stained) for 15min at 120°C in a pressure cooker or 15min to 1h at 90°C in water bath or oven.
- Place roots into Petri dish with 50% (v/v) glycerol for destaining and viewing under stereomicroscope.
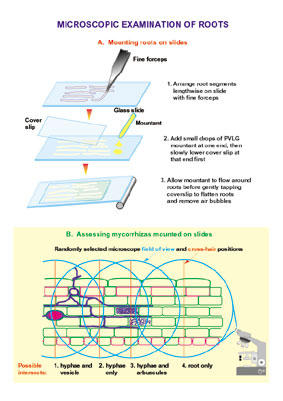 Figure 3
with the permission of Mark Brundett
1.4 Histochemical staining of active AMF mycelium in roots
1.4.1 Succinate dehydrogenase (SDH)- and alkaline phosphatase (ALP) staining of intraradical hyphae
- Wash roots from soil using ice cold water and keep in ice
- Cut roots into 1cm lengths and mix the roots sample uniform
- Take two 0.2-0.5g root samples
- Clear roots in the following solution 2h at room temperature :
20ml 0.05 M Tris/citric acid pH 9.2
50mg/ml sorbitol
15 units/ml cellulase (from A. niger)
15 units/ml pectinase (from A. niger).
- Rinse roots with water on a fine sieve.
- Put the roots sample into two bottles marked with SDH and ALP separately, and add 20ml solution A and B separately
- Incubate roots pieces overnight at room temperature
- Pour out mixture solution, wash with distilled water
- Put the roots marked SDH and ALP in sodium hypochlorite solution(containing 3% and 1% active chlorine separately) 5min, then wash with distilled water
- Transfer the roots into a Peri dish
- Observe purple-black or dark-brown particles in roots under microscope
- Estimate root length containing stained hyphae (see section 1.5 and figure 3)
Solution A for SDH staining
| Chemical |
Concentration |
Volume(ml) |
| Tris/HCl (pH 7.4) |
0.2 mol.l-1 |
5 |
| MgCl2 |
5 mmol.l-1 |
2 |
| NBT |
4 mg.ml-1 |
5 |
| H2O |
|
6 |
| Na-succinate |
2.5 mol.l-1 |
2 |
*NBT------ Nitro-blue Tetrazonium, prepared daily.
Solution B for ALP staining
| Chemical |
Concentration |
Volume(ml) |
| Tris/citric acid (pH 9.2) |
0.05 mol.l-1 |
18ml |
| a -naphthyl acid phosphate |
1 mg.ml-1 |
20mg |
| Fast Blue RR salt |
1 mg.ml-1 |
20mg |
| MgCl2 |
0.5 mg.ml-1 |
1 ml |
| MnCl2.4H2O |
0.8 mg.ml-1 |
1 ml |
1.5. Estimation of AMF colonisation
Estimation of mycorrhizal colonization according to Trouvelot et al
a. Mount 15 root fragments on one slide; prepare two slides (30 root fragments total).
b. Observe these fragments under the microscope and rate according to the range of classes indicated in figure 4 and Annex 1. These classes give a rapid estimation of the level of mycorrhizal colonisation of each root fragment and the abundance of arbuscules.
c. Put the values into the computer program 'Mycocalc' to calculate the parameters: %F, %M, %m, %a and %A, according to Trouvelot et al.. 1986. (see Figure 4 from Trouvelot et al 1986)
- Frequency of mycorrhiza in the root system
F% = ( nb of fragments myco/total nb)*100
- Intensity of the mycorrhizal colonisation in the root system
M% = (95n5+70n4+30n3+5n2+n1)/(nb total)
where n5 = number of fragments rated 5; n4 = number of fragments 4 etc.
- Intensity of the mycorrhizal colonisation in the root fragments
m% = M*(nb total)/(nb myco)
- Arbuscule abundance in mycorrhizal parts of root fragments
a% = (100mA3+50mA2+10mA1)/100
where mA3, mA2, mA1 are the % of m, rated A3, A2, A1, respectively, with mA3=((95n5A3+70n4A3+30n3A3+5n2A3+n1A3)/nb myco)*100/m and the same for A2 and A1.
- Arbuscule abundance in the root system
A% = a*(M/100)
Figure 4
1.6. Histochemical Staining of Total and Active Soil Mycelium
1.6.1. Extraction and measurement of AM fungal hyphae in soil
- Take soil cores (1x6cm) randomly from pots.
- Mix the soil sample well and then put a 2 gram sample in a 500ml beaker.
- Suspend the soil in 250ml distilled water.
- Filter the soil suspension through a 300m m mesh sieve.
- The washings are collected and blended 30 seconds at high speed in a blender.
- Transfer the suspension to a flask, shake by hand and then stand on the bench for one minute.
- Pipette 10ml (5mlx2) aliquots onto a millipore filter(1.0m_m pore size) and filter under vacuum using the filter holder.
- Place the filter on a microscope slide and let dry
- Stain the hyphae on the filter in lactic glycerol-trypan blue (0.05% (v/v)) for 5 minutes.
- Observe the stained filter under a coverslip at 200X magnification.
- Examine 30 random fields and estimate hyphal length by using a grid line interception method as used for evaluating mycorrhizal root lenthes (see Figure 5 from Brundett bet al 1996).
 Figure5
with the permission of Mark Brundett
1.6.2. Estimation of succinate dehydrogenase (SDH)- and alkaline phosphatase (ALP)- active hyphae in soil
- Take soil cores and put in a beaker on ice.
- Mix the soil sample well and take two 2 gram subsamples.
- Put the sub-samples in two bottles marked with SDH and ALP separately, and cover the soil with 20ml ice-cold water immediately
- Add 20ml incubation solution A in the bottle marked with SDH, and add 20ml solution B in the bottle marked with ALP.
- Incubate the soil suspension at room temperature for 3 hours.
- Filter the suspension through a 300m m mesh sieve with 210ml distilled water.
- The collected washings are blended at high speed for 25 minutes.
- Transfer the suspension to a flask and leave to stand on the bench for one minute.
- Pipette 10ml (5mlx2) aliquots on a millipore filter, filter under vacuum as above.
- Transfer the filter onto a microscope slide.
- Counterstain AMF hyphae on the filter with 0.1% basic fuschin for 5 minutes.
- Cover the filter with a coverslip and observe under the microscope at 200X magnification.
- Estimate stained hyphal length using the gridline intersect method.
|
Solution A for SDH staining
|
| Chemical |
Concentration |
Volume |
| Tris/HCl(pH7.4) |
0.2M |
5ml |
| MgCl2 |
5mM |
2ml |
| *NBT |
4mg/ml |
5ml |
| H2O |
2.5M |
6ml |
| Na-succinate |
2.5M |
2ml |
*NBT:Nitro-blue Tetrazonium,prepared daily.
|
Solution B for ALP staining
|
| Chemical |
Concentration |
Volume |
| Tris/citric acid (pH 9.2) |
0.05M |
18ml |
| a-naphthyl acid phosphate |
1mg/ml |
20mg |
| Fast Blue RR salt |
1mg/ml |
20mg |
| 10%MgCl2 |
0.5% |
1ml |
| 10%MnCl2 |
0.5% |
1ml |
1.7. References
- Boddington,C.L.; Bassett,E.E.; Jakobsen,I.; Dodd,J.C. 1999 Comparison of techniques for the extraction and quantification of extra-radical mycelium of arbuscular mycorrhizal fungi in soils. Soil Biol.Biochem. 31: (3) 479-482.
- Brundrett, M., N. Bougher, B. Dell, T. Grove and N. Malajczuk 1996 Working with mycorrhizas in forestry and agriculture. ACIAR Monograph 32.374. ISBN 1 86320 181 5.
- Gianinazzi S, Gianinazzi-Pearson V & Dexheimer J (1979) Enzymatic studies on the metabolism of vesicular-arbuscular mycorrhiza. 3. Ultrastructural location of acid and alkaline phosphatase activity in onion roots infected by Glomus mosseae (Nicol. & Gerd.). New Phytol 82, 127-132.
- Tisserant B, Gianinazzi-Pearson V, Gianinazzi S & Gollotte A (1993) In planta histochemical staining of fungal alkaline phosphatase activity for analysis of efficient arbuscular mycorrhizal infections. Mycol. Res. 97, 245-250.
- Trouvelot A, Kough JL & Gianinazzi-Pearson V (1986) Mesure du taux de mycorhization VA d’un système radiculaire. Recherche de méthodes d’estimation ayant une signification fonctionnelle. In : Physiological and Genetical Aspects of Mycorrhizae, V. Gianinazzi-Pearson and S. Gianinazzi (eds.). INRA Press, Paris, pp. 217-221.
- Vierheilig H. & Ocampo JA (1989) Relationship between SDH-activity and VA mycorrhizal infection. Agriculture, Ecosystems and Environment 29, 439-442.
see these website for further informations:
BEG (Banque Européenne des Glomales) website
Mark Brundrett's Working with Mycorrhizas in Forestry and Agriculture
2.0 - DNA Techniques: PCR of ribosomal DNA from spores
2.1. Introduction to the Polymerase Chain Reaction
The Polymerase Chain Reaction (PCR) is an in vitro technique enabling chemical amplification of DNA. With the improvement brought by the use of the heat stable Taq DNA polymerase of Thermus aquaticus and automation it is possible to obtain quick amplification even of single copy genes, starting from minute amounts of material. The impact of this technique in molecular biology is comparable to that which followed the discovery of restriction enzymes. It has been adapted for a wide variety of applications, and in particular PCR has opened the possibility to analyse organisms at the nucleic acid level even when only small amounts of nucleic acid can be obtained, as in the case of arbuscular mycorrhizal (AM) fungi. Furthermore, although the efficiency of PCR amplification is dependent on the purity of the target DNA, Taq DNA polymerase is less sensitive to template purity than other molecular biology techniques so that partially purified nucleic acid can be used. This feature is a great advantage for plant/soil microbiology research, as investigations can be made directly on partially purified biological material, like fungal spores or infected plant roots.
Ribosomal genes are multicopy genes tandemly organised in the genome. Each ribosomal genes encodes for three subunits (18S[SSU], 5.8S and 28S[LSU]) separated from each other by a Inter Non Transcribed region (ITS). The genes themselves are separated from each other by an Inter Genic Spacer (IGS) (see figure).
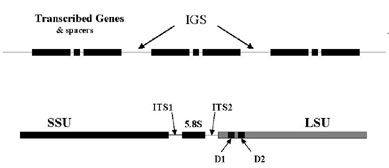
The various characteristics of rRNA and rDNA have made them a choice target for phylogenetic and taxonomic studies, and comparative studies of the nucleotide sequences in ribosomal genes has provided data for the analysis of phylogenetic relationships over a wide taxonomic range of organisms. The nucleotidic polymorphism is not evenly distributed throughout the ribosomal genes and the three regions evolve at different rates. ITS and IGS are variable regions which mutate more frequently than the three conserved coding subunit regions (18S, 5.8S, 25S). This generally makes the former more informative for analyses of closely related genomes, whereas the coding regions of the small and the large ribosomal subunit are considered to be more useful for understanding more distant relationships at the species/order level.
The internal transcribed spacer region like the intergenic spacer region, evolved much faster and sequence differences between different populations of one species, or in a single spore in the case of the Glomales, can be detected. The 5' end of the large ribosomal subunit harbours two informative polymorphic domains (D1 and D2). The polymorphism observed in these domains between and in a taxa, allows also to identify specific nucleotidic sequences which can be used to design primers with different level of specificity or discrimination (van Tuinen et al 1998a).
2.2. Practical aspects of PCR
The Polymerase Chain Reaction is an in vitro technique which allows the amplification of a specific region of DNA located between two known sequences. After each cycle of denaturation, annealing and extension the amount of DNA is double. Potentially, after 20 cycles of PCR, there will be a 220- fold amplification (or 1.106). This illustrates the sensitivity of this method, and the potential artifactual amplification of DNA, as any traces of DNA can be amplified.
SCHEMATIC REPRESENTATION OF THE POLYMERASE CHAIN REACTION
Before the discovery of thermostable polymerase, DNA polymerases such as the Klenow fragment of E. coli DNA polymerase I or T4 DNA polymerase were used. Due to their heat lability, fresh aliquots of enzymes had to be added after each denaturation cycle. The first heat stable DNA polymerase (Taq polymerase) was purified from Thermus aquaticus . Today several heat stable polymerase are available, they are of natural or recombinant origin and vary in their biochemical properties such as extension rate, thermal stability, 5'?3' or 3'?5' exonuclease activity. The specificity and activity of the same enzymes is also very dependent on the producer. Some enzymes such as Tth, have a reverse transcriptase activity, they cannot therefore be used for the synthesis of cDNA.
Beside the enzyme the other factors that can affect the PCR reaction are:
- Primers
- MgCl2 concentration
- Primer concentration
- Primer sequence
- Reaction stringency
- Length of the amplification product
- Number of PCR cycles
- other unknown factors
For each PCR reaction the optimal conditions can vary depending mainly on the primer-DNA combination.
The dNTP's are generally used at a concentration of 100µM, although at lower concentrations (10-100 µM) Taq polymerase has a higher fidelity.
The most common buffer used with the Taq polymerase is:
- 10 mM Tris/HCl pH 8,3
- 50 mM KCl
- 1.5 mM MgCl2
- 0.1% (w/v) gelatin
The MgCl2 concentration affects the specificity of the PCR reaction. A too low concentration affects the final yield whereas a too high concentration reduces the specificity of the reaction. Other components often present in DNA extraction buffer can affect the enzyme activity. SDS at a concentration > 0.01% inhibits the polymerase. The inhibition of SDS (0.01%) can be reversed by some non-ionic detergents (0.5 % (v/v) Tween 20, NP 40).
The primer working concentration is generally of 0.5 - 1 µM. If the primer concentration is too high primer dimerisation can occur.The primer composition is very important. In most PCR applications, the primers are designed to be exactly complementary to the template DNA. The general rules for the primer design are: a length of about 20 - 30 nucleotides. Shorter primers can be used with success and primers longer than 30 do not increase the specificity of the binding
the GC content should be about 50%
the 3' ends should not be complementary, as primer dimerisation will occur
the 3' of the primer should be as homologous as possible
the 5' can be modified to add a restriction site or a GC clamp, in this case, both primers should be equivalent in their melting temperatures
The number of the cycles can be increased to increase the amount of product recovered, but this will also increase non-specific amplification.
Beside all these factors, some primer combinations will work very well, and others not. As so many factors affect the PCR reaction it is very important to have a positive and negative control in an PCR reaction.
2.3. Contamination
As the PCR reaction is so sensitive, precautions have to be taken to avoid undesirable amplifications., such as using DNA free water and negative controls with every set of amplifications.
Thermostable DNA polymerases and their sources
| DNA polymerase |
Natural/recombinant |
Source |
| Taq |
Natural |
Thermus aquaticus |
| Amplitaq® |
Recombinant |
T. aquaticus |
| Amplitaq® (Stoffel fragment) |
Recombinant |
T. aquaticus |
| Hot TubTM |
Natural |
Thermus flavis |
| PyrostaseTM |
Natural |
T. flavis |
| VentTM |
Recombinant |
Thermoccucus litoralis |
| DeepVentTM |
Recombinant |
Pyrococcus GB-D |
| Tth |
Recombinant |
Thermus thermophilus |
| Pfu |
Natural |
Pyrococcus furiosus |
| Pfu |
Cloned |
Pyrococcus furiosu |
| Exo-PFU |
Recombinat |
Pyrococcus furiosu |
| UITmaTM |
Recombinant |
Thermotoga maritima |
Properties of DNA polymerases commonly used in PCR
| |
Taq/
Amplitaq® |
Stoffel
fragment |
VentTM |
Deep-Vent TM |
Pfu |
Tth |
UITmaTM |
| Thermostability- half-life at 95°C |
40
|
80
|
400
|
1380
|
>120
|
20
|
>50
|
| 5’ - 3’ exonuclease activity |
Yes
|
No
|
No
|
No
|
No
|
Yes
|
No
|
| 3’ - 5’ exonuclease activity |
No
|
No
|
Yes
|
Yes
|
Yes
|
No
|
Yes
|
| Extension rate (nt/sec) |
75
|
>50
|
>80
|
n.i.
|
n.i.
|
30-40
|
n.i.
|
| Reverse transcriptase activity |
Weak
|
Weak
|
n.i.
|
n.i.
|
n.i.
|
Yes
|
n.i.
|
| Resulting DNA ends |
3’A |
3’A |
>95%
blunt |
>95%
blunt |
n.i. |
3’A |
Blunt |
| Molecular weight (kDa) |
94 |
61 |
n.i. |
n.i. |
92 |
94 |
70 |
from : PCR Newton, C.R. and Graham, A. BIOS Scientific Publishers Limited 1994
2.4. PCR from AMF
We present a protocol which has been used to amplify the 5' end of the large ribosomal unit of Glomales, using the fungal spore as starting material. This method can be applied to other types of biological material, like plant roots (van Tuinen et al 1998b; Jacquot et al. 2000; Turnau et al. 2001)
2.4.1. Preparation of the nucleic acids
a. Collect clean and shiny Glomalean spores (1 to 10) with forceps under a binocular microscope and rinse with distilled water.
b. Transfer the spores to a 1.5 ml Eppendorf tube containing 10 µl water and crush by means of a micropestle, or a glass Pasteur pipette. Disposable micropestles are available from many laboratory suppliers, and can be reused after incubation for several hours in 0.1 N NaOH to digest any remaining DNA.
c. Add 30µl 100 mM Tris/HCl pH 8.0 and 10 µl of 20% Chelex 100 (Bio Rad) to the crushed spores. Vortex this suspension and then bring to 95 °C for 5 min. Cool on ice.
d. Clear the suspension by centrifugation for 1 min and discard the pellet. The supernatant contains the nucleic acids for the PCR reactions. Depending on the nature of the species analysed, and especially its DNA content, the supernatant obtained can be directly used as template for PCR amplification, or be diluted up to 1/100 before use. This DNA preparation should stored at -20 °C until use.
2.4.2. Preparation of the PCR reaction
- Each PCR reaction is performed in a final volume of 50 µl.
- For each set a amplification reaction a negative control, without DNA, has to be made.
Each reaction mixture contains:
For convenience and to minimise the risk of contamination, a master mixture is prepared with all the reagents except the template DNA.
For PCR machine without heated lid, 25 - 50 µl mineral oil is laid over the mixture, and quickly spun down onto the surface.
25 to 35 PCR cycles are performed as follows:
- Denaturation: at 95 °C for 3 minutes for the initial denaturation, 93 °C and 45 seconds for the remaining cycles.
- Annealing: at 62 °C for 45 seconds.
- Extension: at 72 °C for 45 seconds (1 minute per 1 kb is an average polymerisation speed of Taq DNA polymerase).
- A final extension of 5 minutes is performed at the end of the cycles.
2.4.3. Gel electrophoresis
Electrophoresis through a medium such as agarose or polyacrylamide is a standard method for the separation and purification of nucleic acids. As nucleic acids are charged molecules they will migrate when exposed to an electric field. The size of the molecules to be resolved will, influence the choice of the electrophoretic separation media. For fragments up to 500 bp, polyacrylamide gels are the most effective. Whereas for larger molecules agarose will be the medium of choice. Similar to polyacrylamide gel electrophoresis, there is a linear relationship between agarose concentration and the logarithm of the molecular weight of the DNA.
Range of Separation In Gels Containing Different Amounts of Agarose
| Amounts of agarose in gel in TAE (% [w/v]) |
Efficient range of separation of linear DNA molecules (kb) |
|
0.3
|
5-60
|
|
0.6
|
1-20
|
|
0.7
|
0.8-10
|
|
0.9
|
0.5-7
|
|
1.2
|
0.4-6
|
|
1.5
|
0.2-3
|
|
2.0
|
0.1-2
|
The migration of the DNA molecule also depends on it's conformation. The DNA molecule can be superhelical (form I), nicked circular (form II) or linear (form III). Depending on the electrophoretic conditions (ionic strength of the buffer, intensity of the electric field) the form I can migrate faster then the linear form.
Generally the DNA molecule is visualised after electrophoresis by staining with ethidium bromide (EtBr).
BE CAREFUL WHEN MANIPULATING Ethidium Bromide.
IT IS A POWERFUL MUTAGEN.
Ethidium bromide is a fluorescent dye which intercalates between the bases of DNA. After irradiation with UV light the bound dye retransmits the light at 590 nm. Through this staining, which can be done during or after the electrophoresis, small amounts of DNA (<10 ng) can be detected.
2.4.4. Nested PCR Reaction
The aim of the nested PCR reaction is to increase the specificity of the amplification reaction by performing two PCR amplifications one after the other.
The first PCR reaction is performed as previously described, but for the second reaction the amplification products obtained in the first amplification cycles are used as template, after a dilution of up to 103, an internal primer.
In this way the specificity of the amplification is increased as the target DNA to be amplified requires to possess the three primer binding, the efficiency of the amplification is increased as the number of cycles can be increased, without loss of specificity.
Protocol
a. After the first PCR amplification, the reaction is checked by loading 5 µl of the amplification product on an 1.2 % agarose gel.
b. For the nested PCR reaction 5µl of the amplification product diluted 500x, are used as target for the second round of amplification (25 cycles)
c. The annealing temperature will depend on the primer pair used.
Abbreviations:
SDS: sodium dodecyl sulfate
dNTP: deoxynucleosides triphosphate
TAE: Tris-acetate (40 mM Tris-acetate pH 8.0 ; 1 mM EDTA)
TE: Tris-EDTA (10 mM Tris/HCl pH 7.4-8.0 ; 1 mM EDTA)
EDTA: ethylenediaminetetraacetate
- Jacquot-Plumey, E van Tuinen, D Gianinazzi, S and Gianinazzi-Pearson, V 2000 Monitoring species of arbuscular mycorrhizal fungi in planta and in soil by nested PCR : application to the study of the impact of sewage sludge. Plant Soil 226, 179-188.
- Turnau, K Ryszka, P Gianinazzi-Pearson, V and van Tuinen, D 2001 Identification of arbuscular mycorrhizal fungi in soils and roots of plants colonizing zinc wastes in southern Poland. Mycorrhiza 10, 169-174.
- van Tuinen, D Zhao, B and Gianinazzi-Pearson, V 1998a PCR in studies of AM Fungi: from Primers to Application. In Mycorrhiza Manual . A. K. Varma (eds) Springer-Verlag: Heidelberg , pp. 387-400
- van Tuinen, D Jacquot, E Zhao, B Golotte, A and Gianinazzi-Pearson, V 1998b Characterization of root colonization profiles by a microcosm community of arbuscular mycorrhizal fungi using 25S rDNA-targeted nested PCR. Mol Ecol 7, 103-111.
3.0 DNA Techniques: PCR-SSCP analysis
3.1. Introduction
The ultimate character that can be used to distinguish species is variation in DNA sequence between homologous genes or regions. The distinguishing patterns obtained with PCR-SSCP are sequence dependant and utilise minor nucleotide differences across several hundred bases of sequence, but without recourse to sequencing. PCR-SSCP is a simple procedure where denatured PCR products are electrophoresed through a non-denaturing polyacrylamide gel. The single strands adopt primary conformations that are dependent on their nucleotide sequence and this determines the rate at which they migrate through the gel matrix. Each PCR product with a different sequence therefore, will be theoretically represented by two bands corresponding to the two strands of the amplified molecule. SSCP has been shown to be able to detect single base changes in 99% of PCR products between 100 and 300 base pairs in length although this limit reduces to 89% with products between 300 and 450 base pairs [Hayashi, 1991; Hayashi and Yandell 1993]. However, the detection of minor sequence variation has been reported in molecules up to 775 nucleotides in length [Orti et al., 1997] although careful optimisation of conditions is required. Optimisation of the technique must be carried out empirically [Hayashi and Yandell 1993; Orita et al., 1989] since it is not possible to predict the optimal conditions for band separation in advance [Spinardi et al., 1991], but once achieved, the reproducibility of profiles enables easy comparison between samples. The factors affecting SSCP are reviewed by Hayashi and Yandell [Hayashi and Yandell 1993]. SSCP therefore, has the potential to allow the use of levels of variation that are seldom available to other techniques. In practice however, sequence differences between species in variable regions such as the Internal Transcribed Spacers (ITS), are frequently represented by more than a single base change and so separation does not usually rely on such high levels of sensitivity. In the application described here, the advantages of a PCR-based strategy are combined with SSCP which allows the origin of PCR products to be determined on the basis of the entire sequence across a particular region and visualised as a distinct pattern of bands. This assumes that particular sequences are associated with particular species. These band patterns are compared to those obtained directly from control isolates or from local pattern databases. It should be noted that the data obtained from SSCP gels cannot be used for phylogenetic analysis since specific band patterns cannot be associated with changes at particular loci.
3.2. DNA extraction
In terms of the identification of fungi, there are two main areas where the application of PCR-SSCP is particularly useful. The first is the typing of unknown isolates and the second is the detection and identification of fungi in situ. The PCR primer strategy adopted is dependant on which of these is required. Primers with broad specificity can only be used with DNA samples of single species origin or with simple mixtures. Primers capable of amplifying the majority of fungi can be applied to identify material in culture since in most instances only a single sequence and therefore pattern will be obtained (see Interpretation of SSCP profiles). This approach has proved to be very effective when targeting variable regions such as the Internal Transcribed Spacers (ITS) of the ribosomal RNA gene clusters (LSU-D2). It has also proved to be similarly effective for the identification of plant-parasitic [Clapp et al., 2000] and animal parasitic nematodes [Gasser, 1997; Hayashi, 1991]. In complex communities where in situ identification is required, unless the situation is simple, the specificity of the primers should be raised to encompass defined taxa, for example only members of a single genus.
Methods for the extraction of DNA from AMF spores have been given in section 2.4.1. The method described here for the isolation of DNA from fungal mycelium and plant root tissue is preferred due to its simplicity and reproducibility.If a bead beater is not available, freezing the plant material in liquid nitrogen and grinding to a find powder in a mortar and pestle before resuspension in lysis buffer will suffice. However, this method results in relatively low sample throughput.
3.2.1 Extraction of DNA from fungal isolates
1. Take approximately 400mg of fungal mycelium from the outermost area of a colony and place in a screw-capped tube containing 600µl of DNA lysis solution (Puregene, Biozym) with 300mg of 0.5mm diameter glass beads (Biospec Products, Techno Lab International, Alkmaar, NL).
2. Triturate the mycelium by beating in a minibead-beater (Biospec Products) for 4 x 30 seconds at 5000 beats per minute. Cool the tube on ice between each cycle.
3. After the final beating, incubate the disrupted fungal mycelium at 65ûC for one hour, then extract with buffered phenol (pH7) until there is no evidence of protein at the phenol/lysis buffer interface.
4. Extract with chloroform/isoamyl alcohol (24:1) to remove any remaining traces of phenol.
5. Finally, precipitate the DNA with alcohol (ethanol or isopropanol) wash the pellet with 70% ethanol and resuspend in 50-100µl TE buffer. (DNA concentration can be established using a bench spectrophotometer (such as GeneQuant, Amersham Pharmacia Biotech).
Solutions and reagents
- lysis solution (Puregene, Biozym)
- buffered phenol (pH7)
- chloroform/isoamyl alcohol (24:1)
- ethanol or isopropanol
- 70% ethanol
- TE buffer (1x: 10mM Tris, 1mM EDTA)
3.2.2 Extraction of DNA from plant root material
- Individually brush root pieces in water to remove large pieces of adhering debris, then transfer to tubes containing deionised water and place in a sonicating water bath (e.g. Bransonic 2200, 47KHz) for 3 minutes. This step removes hyphal fragments adhering to or protruding from the root cortex and should be confirmed by subsequent microscopic examination.
- Place the root pieces individually in screw-capped tubes containing 600?l of DNA lysis solution (Puregene, Biozym), 300mg of 0.5mm diameter glass beads and 500mg 1.0mm diameter zirconium beads (Biospec Products, Techno Lab International, Alkmaar, NL).
- Triturate the root material by beating in a minibead-beater (Biospec Products) for 4 x 30 seconds at 5000 beats per minute and cool on ice between each cycle. After the final beating incubate the disrupted root tissue at 65ûC for one hour, beat once more and treat as described for the extraction of DNA from fungal isolates.
Solutions and reagents
- lysis solution (Puregene, Biozym)
- buffered phenol (pH7)
- chloroform/isoamyl alcohol (24:1)
- ethanol or isopropanol
- 70% ethanol
-TE buffer (1x: 10mM Tris, 1mM EDTA)
3.2.3. DNA extraction from AMF spores
- Extract spores from the soil or soil medium by wet sieving [Brundrett et al., 1996]. DNA can be extracted from single or multiple spores in a similar manner.
- Place the spores in a sonicating water bath (e.g. Bransonic 2200, 47KHz) for 3 minutes to remove surface debris then transfer to a 0.5ml tube and crush with a micropestle in 50?l DNA lysis solution (Puregene, Biozym).
- Centrifuge the crushed spore solution through glass wool to remove fragments of the spore wall and incubate the aqueous phase at 65ûC for one hour.
- Extract the solution once with chloroform to remove protein and precipitate the DNA with one volume of isopropanol and 20mg of glycogen (Boehringer Mannheim) acting as an inert carrier.
- Wash the nucleic acid pellet in 70% isopropanol and resuspend in 20?l TE.
Solutions and reagents
- lysis solution (Puregene, Biozym)
- chloroform
- isopropanol
- glycogen (Boehringer Mannheim)
- 70% ethanol
- TE buffer (1x: 10mM Tris, 1mM EDTA)
3.3. PCR
SSCP can be applied to any fungal group for which suitable PCR primers can be designed using available sequence information (such as: National Biotechnology Information Center http://www.ncbi.nlm.nih.gov/). Since the ability of PCR-SSCP to distinguish dissimilar sequences relies on differences between the PCR primers sites not at them, primers can be designed that work for larger taxonomic groups. Thus, sequence information need not necessarily be available for the taxon or strain under examination as long as it falls within the phylogenetic breadth of the primer set used. This enables the design of primers and identification to species (or lower) by PCR-SSCP without the need for sequencing all members of a particular taxon. Unlike with the design of specific primers, where unique sequences are sought for each species and which therefore requires the sequence data for each species to be known, it is often enough with PCR-SSCP to assume that regions shared between several members of a genus are also shared by several other members where the sequences are not known.
The primer pair (5’5.8S/ITS4) has been effective across several fungal taxa and will be used in this workshop. This primer pair has been used extensively to assist with the typing of fungal isolates and is targeted at the 5.8S ribosomal RNA gene and the second internal transcribed spacer (ITS2). The ITS2 region of the rRNA gene cluster is specifically targeted since variation has been reported to be higher than that of the ITS1 [O'Donnel, 1992]. The sequences of the ITS2 primer pair are: 5’5.8S (5'GCATCGATGAAGAACGCAGC) and that of ITS4 [White et al., 1990]. The 5’5.8S primer sequence is conserved across the majority of available fungal sequences and yielded products in the range of 320 to 450 base pairs in combination with ITS4.
The PCR parameters used are as follows: 96°C for 55 seconds, 61°C for 55 seconds, 72°C for 45 seconds-10 cycles; next 20 cycles - anneal temperature reduced to 59ûC and extension time increased to 2 minutes; final 15 cycles - anneal temperature reduced to 58°C and extension time increased to 3 minutes.
All amplifications were carried out in a volume of 20µl using 5ng template DNA, 20µM dNTP’s, 0.4U DNA polymerase (e.g. Tbr DNA polymerase 'DynaZyme', Finnzymes) and 20pmol of each primer. The thermocycler used was a PTC-200 (MJ-Research) with heated lid and did not require an oil overlay. The quality of PCR products should always be checked by agarose gel electrophoresis before attempting SSCP. [NOTE: PCR from mixed species templates often results in the detection of more than one band after agarose gel electrophoresis. This is due to size polymorphism of the PCR target region (ITS)].
Solutions and Reagents
- 10x PCR buffer (constituents differ depending on enzyme type)
- 4mM stock dNTPS (Pharmacia)
- DNA polymerase (here * DNA polymerase)
- sterile water
- PCR primers
- Template at correct concentration
3.4. Single strand conformational polymorphism (SSCP)
3.4.1. Optimisation of SSCP
PCR product quality is clearly central to the effectiveness of the SSCP and care should be taken to ensure that the PCR conditions are optimised before continuing with the samples. As far as possible all conditions should be reproduced accurately for each SSCP. Running buffers should be fresh for each run with no precipitate in stock bottles.
SSCP relies on differential folding of PCR products and is therefore dependant on internal base-pairing. Ambient temperature, gel glycerol content, polyacrylamide concentration and the power (W), and therefore the heat generated within the gel, at which the samples are run may all affect the folding of strands. Optimal separation of SSCP bands occurs in gels with low cross linking (approx 2%) and in the presence of 5-10% glycerol [Orita et al., 1989]. However, the optimal conditions for running each sample is dependant on the sequence being dealt with, thus optimal conditions cannot be predicted and must be determined empirically. In practice, the majority of samples can be separated using the conditions indicated but occasional failures may be attributed to sub-optimal conditions for a particular sample. In particular, the presence of heteroduplexes should be addressed. These molecules represent double-stranded molecules where the individual strands originate from different organisms. Heteroduplexes are not usually encountered with PCR products originating from individual cultures however, they may occur frequently in field samples if the conditions of PCR or SSCP are not optimal (see Interpretation of SSCP profiles). When encountered, gels containing no glycerol (MDE) and the use of an alkali denaturing buffer (NaOH) can overcome the problem [Lee et al., 1996].
3.4.2. Gel pouring (See also Labsheets 1 and 2, Annex 4 )
SSCP gels are run on standard manual or automated sequencing systems. The following description is based on a wide H03 manual system (Amersham Pharmacia Biotec) and used a 64 well sharks-tooth comb.
Steps in the procedure
- Plates, 0.4mm spacers and combs must be immaculately clean before the gel is poured. They should be washed in detergent and cleaned several times with methanol before proceeding further. If silver staining is to be used the small plate should be coated with Bind Silane (hydrophilic - Sigma) (3?l in 1ml 10% acetic acid in ethanol) and the large with Repel Silane (1ml) (hydrophobic - Sigma). The hydrophilic coating facilitates the retention of the gel on the small plate during staining. Failure to use bind silane will result in the gel coming away from the plate. If radiolabelling and autoradiography is used, bind silane is not necessary however the hydrophobic coating should be applied to the large plate. In this case the small plate should be cleaned with 10% potassium hydroxide dissolved in methanol and then rinsed extensively with water. This treatment removes any traces of the hydrophobic coating on the small plate. Both silanes should be allowed to 'cure' for two or three minutes before the acetic acid liberated is gently removed by washing with distilled water and the plates dried.
- Pouring the gel is most simply achieved by fastening the glass plates together (with spacers between) using Bulldog clips and placing the gel horizontally with the small plate uppermost to allow access to the well area. Taping is not necessary.
Solutions and reagents
- methanol
- detergent
- MilliQ water or equivalent
- Bind Silane (hydrophilic - Sigma) 0.03% (v/v) in 10% (v/v) acetic acid
- Repel Silane (1ml) (hydrophobic - Sigma)
- 10% (w/v) KOH dissolved in methanol
[NOTE: unpolymerised acrylamide is a cumulative neurotoxin and care should be taken at all times with its use]
- Pour a 0.5x MDE (FMC BioProducts) non-denaturing polyacrylamide gel as follows.
- Add 25ml , 2x MDE gel solution and 6ml of 10x TBE buffer to a clean beaker containing 68.56 ml deionised water (MilliQ). [Note: the constituents for 100ml gel are given, the wide H03 system (Pharmacia) used in this lab requires that only 50ml of gel solution is made, the amount needed should be determined in advance].
- Add 40µl TEMED and 400µl fresh 10% (w/v) ammonium persulphate to the gel solution and swirl to mix. The gel will now begin to polymerise.
- Load the gel mixture into a suitably sized syringe and run in between the plates. Gentle tapping can help the flow of the gel matrix. The straightness of the gel front is an indicator of the cleanliness of the glass plates. When the gel is poured insert the comb. Well forming combs with the teeth in the gel, sharks tooth combs with the teeth away from the gel. Allow the gel to polymerise for at least one hour before loading samples. With the sharks tooth comb reverse and reinsert teeth into the gel before sample application. Well forming combs should simply be removed.
- Load the polymerised gel into the apparatus using precooled (4ûC) 0.6x TBE running buffer in the reservoirs to reduce possibility of sample renaturation.
3.4.4. Sample preparation and electrophoresis
- Take 5µl of PCR product and add to 25µl of denaturing loading buffer (95% (v/v) formamide, 10mM NaOH, 0.25% (w/v) bromophenol blue, 0.25% (w/v) xylene cyanol). The precise dilution should be determined empirically.
- Denature for 2 minutes at 94ûC and cool immediately on wet ice.
- Load 3-5µl per well.
- The precise duration and power at which the electrophoresis is carried out is dependant on the size of the PCR product and the degree of band separation required as well as all the physical factors of the gel itself. However, 6-8W for 15 hours at ambient temperature can be used as a start point. However, we will use: 8W constant power for 19,000 Vhrs.
3.4.5. Labeling/band detection strategy
Silver staining of SSCP gels generally follow established procedures recommended by suppliers (Amersham Pharmacia Biotech.). Once staining is complete the gels are air dried and photographed using a positive film (e.g. Typon, Graphic Arts Film). Silver staining is considered to be the fastest, simplest and safest method for the routine screening of large numbers of samples.
The use of other methods to visualise SSCP bands such as 32P or 33P allow a lower band detection threshold. If 32P labelling is to be used then primers should be end labelled rather than labelled by PCR. In the latter case the signal generated by each strand is dependant on the number of labelled bases in the sequence. This can result in very different band intensities for the two single strands. 35S labelling should not be used with SSCP as this causes a loss of pattern reproducibility [Hayashi and Yandell, 1993].
3.5. Interpretation of SSCP profiles
The vast majority of fungal isolates tested have given simple patterns which can be directly compared to control lanes on the same gel or to an internal standard. Patterns from root samples usually need to be treated with more caution since there is frequently more than one fungus present in the sample. If general primers amplifying many fungal taxa are used to evaluate field root samples, band pattern complexity is often high and although it is usually possible to identify some of the constituents, many cannot be identified with available comparative material. A lack of comparative material is a constant problem with the investigation of field samples but this is less of a problem if particular taxa are targeted. The excision and sequencing of unidentified bands can enable the phylogenetic association of an unidentified band to be determined in a manner similar to DGGE. The effectiveness of this approach is however dependant on the PCR target investigated and the availability of sequences for comparison.
The patterns obtained with SSCP should theoretically and ideally contain only two bands from each fungus. However, this is rarely the case. Additional bands are often seen even when PCR conditions are known to have been optimised and only a single strain is known to be present. There are several possible causes for this, some arising from the physical properties of the samples and others from inappropriate sample handling.
With respect to the physical properties of the molecules, there are four major potential causes of multiple bands in SSCP gels. The presence of multiple sequences arising from polymorphic gene loci (such might occur as sub-populations in high copy number genes) is a distinct possibility for many fungi [Clapp et al., 1999; Clapp et al., 2001; Lloyd-MacGilp et al., 1996,; O'Donnel, 1992]. A second possible cause of multiple bands is the targeting of an heterozygous allele by PCR. In this case, two bands would represent a homozygote and three or four a heterozygote. Additional bands can also be attributed to the presence of metastable conformers [Zehbe et al., Application Note]. These are bands with identical sequence to those of the primary bands but which form an alternative structure affecting mobility. Without investigating cloned libraries of PCR products however, it is difficult to determine whether the extra bands encountered are metastable conformers or the result of multiple sequences. The presence of metastable conformers has not however, affected the ability of SSCP to effect identifications. A final possibility is that more than one template is present. This might arise through a mixed or contaminated culture or be due to hyperparasitism by another fungus. The latter example is frequently suspected when dealing with AMF spores collected in the field although multiple sequences within individual isolates or spores have been frequently encountered in this taxon [Clapp et al., 1999; Clapp et al., 2001; Lloyd-MacGilp et al., 1996; Sanders et al., 1995].
Sub-optimal handling of samples can also give rise to multiple bands, but the origin of these can usually quickly be determined. If samples have been incompletely denatured or allowed to partially renature prior to loading, then additional bands can result, which correspond to double strands or heteroduplexes (the former being reassociations of complementary strands and the latter occurring in a mixture where homologous but different sequences associate to produce a hybrid double stranded molecule). It is relatively simple to detect the former by including an undenatured sample in each SSCP run. However, undenatured DNA frequently runs faster than single stranded DNA so care should be taken that this control remains on the gel. The chance of incomplete denaturation or renaturation can be reduced by proper treatment of samples. They should be denatured according to the protocols described and immediately placed on wet ice. Loading onto the gel should be carried out as rapidly as possible and cooled buffers used in the reservoirs.
The analysis of heteroduplexes is a recognised method to investigate sequence variation and requires that samples are first denatured and then slowly cooled to room temperature to allow heteroduplex formation. A variation of this technique where excess DNA is added to denaturing buffer can result in both single stranded molecules and duplexes, thus the optimal concentrations for DNA loading should be checked. Heteroduplex analysis can enhance the detection of sequence differences however, since duplexes run faster than single stranded molecules (although this is not always the case), gels often have widely differing single and double stranded band positions with single strands occurring near the wells and duplexes at the base of the gel. This can lead to difficulties with interpretation because of insufficient resolution [Fukai et al., 1995].
It is therefore more difficult to check for the presence of heteroduplexes in SSCP gels than homoduplexes, however if samples are treated as described (no glycerol in gels and use of NaOH in loading buffer), this problem should be minimised. It is not possible to investigate the full range of possible heteroduplexes that could occur when one is dealing with a natural ecosystem comprised of many unknown members. Thus the likely presence and precise mobility of heteroduplex bands cannot be determined for all species encountered in advance. Heteroduplexes can sometimes be separated from single stranded molecules however, on the basis of colour after silver staining [Lee et al., 1996].
3.6. References
- Clapp, J.P., Young, J.P.W. and Fitter, A.H. (1999) Ribosomal small subunit sequence variation within spores of an arbuscular mycorrhizal fungus, Scutellospora sp. Molecular Ecology 8:915-921
- Clapp, J.P. , van der Stoel, I., van der Putten, W.H. (2000) Identification of cyst nematodes (Heterodera, Globodera) and root-knot nematodes (Meloidogyne) on the basis of ITS2 sequence variation detected by PCR-SSCP (PCR-single-strand conformational polymorphism). Molecular Ecology 9: 1223-1232.
- Clapp, J.P., Rodriguez, A. and Dodd, J.C. (2001) Intraspecific LSU variation in spores of isolates of species of Glomus coronatum compared with morphologically-similar species of Glomus. New Phytologist 149(3):
- Fukai, K., Holmes, S.A., Lucchese, N.J., Mok Siu, V., Weleber, R.G., Schnur, R.E. and Spritz, R.A. 1995 Autosomal recessive ocular albinism associated with a functionally significant tyrosinase gene polymorphism. Nature Genetics 9:92-95.
- Gasser, R.B. 1997 Mutation scanning methods for the analysis of parasite genes. Int. J. Parasitol. 27(12): 1449-1463.
- Gasser, R.B., Monti, J.R., Zhu, X., Chilton, N.B., Hung, G-C, Guldberg, P. 1997 Polymerase chain reaction-linked single-strand conformational polymorphism of ribosomal DNA to fingerprint parasites. Electrophoresis 18:1564-1566.
- Hayashi, K. 1991 PCR-SSCP: a simple and sensitive method for the detection of mutations in the genomic DNA. PCR Methods and Applications 1: 34-38.
- Hayashi, K. and D.W. Yandell 1993 How sensitive is PCR-SSCP? Human Mutation 2: 338-346.
- Lee, D-H, Zo, Y-G and Kim, S-J. 1996 Nonradioactive method to study genetic profiles of natural bacterial communities by PCR-single-strand conformational polymorphism. Appl. Env. Micro 62(9): 3112-3120.
- Lloyd-MacGilp, S.A., S.M. Chambers, J.C. Dodd, A.H. Fitter, C. Walker and J.P.W. Young 1996 Diversity of the ribosomal internal transcribed spacers within and among isolates of Glomus mosseae and related fungi New Phytol. 133: 103-111.
- O’Donnel, K. 1992 Ribosomal DNA internal transcribed spacers are highly divergent in the phytopathogenic ascomycete Fusarium sambucinum (Gibberella pulicaris). Curr. Genet. 22: 213-220.
- Orita, M., H. Iwahana, H. Kanazawa, K. Hyashi and T. Sekiya 1989 Detection of polymorphisms of human DNA by gel electrophoresis as single-strand conformation polymorphisms. Proc. Natl. Acad. Sci. USA 86: 2766-2770.
- Orti, G., M.P. Hare and J.C. Avise 1997 Detection of nuclear haplotypes by PCR-SSCP Mol. Ecol., 6: 575-580.
- Sanders IR, Alt M, Groppe K, Boller T, Wiemken A (1995) Identification of ribosomal DNA polymorphisms among and within spores of the Glomales: application to studies on the genetic diversity of arbuscular mycorrhizal fungal communities. New Phytologist 130, 419-427.
- Spinardi, L., R. Mazars and C. Theillet 1991 Protocols for an improved detection of point mutations by SSCP. Nucleic Acids Res. 19: 4009.
- White, T.J., T. Bruns, S. Lee and J. Taylor 1990 Amplification and direct sequencing of fungal ribosomal genes for phylogenies PCR Protocols: A guide to methods and applications. Innis, M.A., Gelfand, D.H., Sninsky, J.J. and White, T.J. Eds. pp315-322. Academic Press, New York.
- Zehbe, I., E. Wilander and J. Sallstrom. Pharmacia Application Note 384, Phast System PP 13-14. (18-1108-53).
4. Compartment systems for ecophysiological studies of AMF
4.1. Three-compartment rootbox to estimate in soil hyphal element uptake capacity
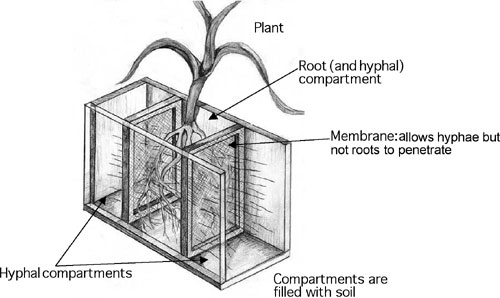
To estimate the depletion of elements from the hyphal compartments, the soil is analysed before planting and after harvest. Alternatively, the activity of hyphae in nutrient uptake can be estimated from (a) the difference in element content of mycorrhizal and non-mycorrhizal plants, or (b) the signal in the shoot from labelled elements supplied to the hyphal compartments.
Advantages of the three compartment system
+ Two interfaces between root and hyphal compartments together with a small size of the root compartment produce a relatively large mycorrhizal contribution to plant P uptake. This facilitates easy comparison between different substrates or AMF isolates.
+ Allows estimation of differences in element depletion with increasing distance to the root surface. For this purpose the soil in the hyphae compartments is cut into slices before being analysed.
+ Allows estimation of changes in hyphal length with increasing distance to the root surface using the same slice technique.
+ Allows application of element sources in different distances from the root surface.
Disadvantages of the three compartment system
- Possible overestimation of the contribution of long-distance hyphae; the contribution of hyphae close to the root surface is underestimated.
- Difficulties in determination of hyphal dry matter per unit soil.
4.2. Glassbeads and nutrient solution to facilitate harvest of hyphae 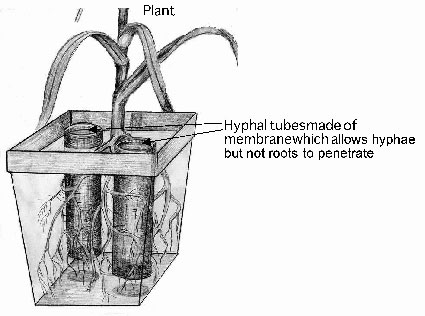
To estimate the hyphal dry matter and to analyse the hyphae for their mineral nutrient content, the soil in the hyphae compartments is replaced by glassbeads (diameter from 1 to 2 mm) supplied with nutrient solution.
After harvest the hyphae can easily be washed from the glassbeads on a 40µm sieve and provide clean material for further analysis.
Advantages of the glass beads and nutrient solution approach
+ Suitable to produce relatively large amounts of clean hyphae
Disdvantages of the glass beads and nutrient solution approach
- Growth of hyphae in glassbeads is not probably different from that in soil
4.3. A tube system to estimate in soil hyphal element uptake capacity
Tubes are inserted into conventional pots. They may contain different types of substrate e.g. different kinds of soil or soil with different fertiliser treatments. These tubes facilitate entry of hyphae through a membrane (for drawing see 2.) The element uptake from the hyphae compartments is determined by soil analysis as described for the compartment system in technique 1. Possible uses are similar to technique 1., but hyphal density (and element depletion) is usually more intense while the effect of plant element content is less than in the three-compartment rootbox.
Advantages of this tube system
+ Does not require the construction of special rootboxes
+ Suitable for use in field experiments
+ Allows the comparison of uptake from different substrates on the same individual plant.
Disadvantages of this technique
- Underestimation of the contribution of mycelium close to the root surface
4.4 Minicompartment system to determine phosphate uptake from different soil layers.
The hyphal compartments are filled with the same soil as the whole rootbox. The depletion of elements by the hyphae from the different soil regions is estimated by soil analysis
Advantages of the minicompartment technique:
+ Allows the estimation of mycorrhizal contribution to element uptake from different soil regions.
Disdvantages of the minicompartment technique:
- Problems in preparing equal rootboxes with homogenous soil bulk densities and hyphal compartments placed at the same positions
- It takes approximately four weeks until, for example, phosphorus depletion from the soil can be measured.
- Underestimation of the contribution of hyphae close to the root surface
Annex 1

Date : F% =
Soil : M% =
Plant : A% =
Fungus : m% =
Treatment : a% =
Replication :
Annex 2 Reagents
Polyvinyl-Lacto-Glycerol (PVLG)
PVLG is used to permanently mount whole or broken spores on glass slides. For best results, mounted specimens should not be studied for 2-3 days after they were mounted to give time for spore contents to clear. Whole spores will change colour, generally darkening to varying degrees, and shrink or collapse with plasmolysis of spore contents. Discrete layers of the spore wall or flexible inner walls of broken spores will swell to varying degrees and appear fused after long storage in some instances.
Ingredient Quantity
Distilled water 100 ml
Lactic acid 100 ml
Polyvinyl alcohol (PVA) 16.6 g
It is most important to mix all ingredients in a dark bottle BEFORE adding polyvinyl alcohol. The PVA should have the following properties: 50 - 75% hydrolyside, and a viscosity of 20 - 25 centipoise in a 4% aqueous solution at 20 C. The PVA is added as a powder the other mixed ingredients and then placed in a hot water bath to dissolve (70 - 80 C), which takes between 4-6 hours. PVLG stores well in dark bottles for approximately one year.
Melzer's Reagent
Ingredient Quantity
Chloral hydrate 100 g
Distilled water 100 ml
Iodine 1.5 g
Potassium iodide 5.0 g
Melzer's reagent can be used alone to mount spores and look for diagnostic iodine staining reactions (to hydrophobic regions of structures), but the mounts are temporary and subject to drying out within 1-2 years of storage. For permanence, Melzer's reagent is mixed in equal proportions with PVLG in a separate dark bottle. There is no diminishing of a staining reaction with the 1:1 dilution. However, the reaction will fade (or disappear in lightly staining structures) in prepared slides after a year or longer of storage.
Sodium Azide
Sodium azide is a respiratory inhibitor and therefore should be handled with care (wearing gloves) in the preparation of stock solutions (2.5 g in 50 ml of distilled water). A one ml aliquot of the stock is added to 90 ml of distilled water for a 0.05% working solution. For vial vouchers, spores are collected and added to 2 ml vials in a minimum of water. The vial is then filled with the sodium azide working solution and labelled. Solutions and vials are stored at 4 C as an added precaution to optimise safety of the workplace.
Spores will darken and contents become cloudy after long term storage, but subcellular structural properties retain their integrity to a great extent. Other preservative solutions such as FAA (Formalin + Acetic Acid + Alcohol) and lactophenol (lactic acid + phenol) have been used extensively in the past, but evidence from type specimens indicates they can cause major changes or degradation of subcellular structure of spores.
Annex 3
Labsheet 1
Instructions for plate preparation for SSCP gels
Treat everything as TOXIC
1) Clean both plates thoroughly using concentrated TEEPOL.
2) Rinse with distilled water and dry.
3) Place plates, gel contact side up and with top towards the edge of the bench, on plastic boxes.
4) Clean the large plate thoroughly with methanol.
5) Make a pad of paper towel and place a splash of SIGMACOTE onto the plate surface. Wipe so it covers the whole plate and allow to dry (1 min).
6) Spray on some distilled water and gently blot the plate dry.
7) CHANGE GLOVES
8) Clean the large plate thoroughly with methanol
9) Add 3µl BIND SILANE to 1ml 10% acetic acid in ethanol and mix.
9) Pour this solution over the plate and quickly wipe over the whole surface using a small pad of paper towel. Leave to dry (5 mins).
11) Wipe the plate 3 times with methanol and then polish with a paper towel. THERE MUST BE NO STREAKS VISIBLE ON THE SURFACE.
12) Place the spacers along each side of the large plate and lie the small plate on top, gel side down. Fix 3 clips along each side of the plate sandwich, ensuring contact in the centre of the spacer.
Labsheet 2
Instructions for making an MDE gel for SSCP
and subsequent staining
Treat everything as TOXIC
Volumes for ge1
lOX TBE 5X TBE Loading Dye
2XMDE 12.5m1 12.5m1 Formamide 95% v/v
TBE 3.0ml 6.0ml NaOH 10mM
MilliQ 34.28m1 31.28m1 Bromophenol blue 0.25%
TEMED 20µl 20µl Xylene Cyanol 0.25%
10%APS 200µl 200µl
0.6X TBE = 60ml 10X TBE in 1L
After cleaning plates (see Labsheet 1), pour between glass plates using a 50ml syringe. Then put in comb and allow 1 hour for the gel to polymerise.
Silver Staining Solutions
| A) 10% acetic acid |
l00ml glacial acetic acid plus 900m1 deionised/distilled water |
| B) Silver Nitrate (AgNO3) |
2 litres MilliQ, add 3.0ml Formaldehyde (37%) and 2g Silver Nitrate |
| C) Sodium Carbonate (NaCO3) |
2 litres MilliQ, add 3.0ml Formaldehyde
(37%), 60g Sodium Carbonate and
400?l Sodium Thiosulphate (1 0mg/ml) |
Staining Protocol
- 20 minutes in 10% acetic acid (A), pour off and SAVE.
- 2 minutes in distilled water, three times
- 30 minutes in enough Silver Nitrate solution (B) to cover gel, tip away down sink
- rinse plate quickly in distilled water and pour away
- add enough Sodium Carbonate solution (C) to cover gel, watch for band development. As soon as the gel is sufficiently stained or begins to yellow at the corners, tip away Sodium Carbonate solution fast
- quickly add saved acetic acid from 1), for 15 minutes, then tip away
- wash in distilled water for 15 minutes
- wipe silver from back of the gel plate and bake in the oven at 70C until dry.
- scan the gel.